Amdocs Zusammen uses collaboration aware store as part of its backend. When it comes to collaboration, a version control system in general, and Git in particular seems a natural choice. But how well does it perform?
In this report we describe our methodology for testing Git performance in the context of Zusammen and analyze its results. Please keep in mind that we did not have comprehensive benchmarking as our goal, but rather an estimate of whether Git can serve the purpose, and up to what limit.
Environment
In Zusammen, a server-side component invokes Git operations to save data and resolve conflicts that inevitably occur when multiple users edit the same piece of data. The component can either have Git embedded in it, or function as a Git client connecting to a Git server. In the latter case, we want the server to run on the same machine to avoid network overhead on the performance.
Although our options as of a particular Git implementation are open, at this time we focus on JGit as a Git library for Java (both client and server), with git daemon for the server.
Virtual Machine
Our setup is a Linux virtual machine running on OpenStack. The VM has 4 VCPUs and 24000 MB of memory, and uses on-compute-node SSD storage.
Software
The operating system is CentOS release 6.5 (Final), Kernel 2.6.32-431.29.2.el6.x86_64, without any special configuration or performance tuning.
We used git daemon version 2.11.1 as a Git server implementation. It was started with the command
git daemon --reuseaddr --base-path=/root/git/ --verbose --export-all --enable=receive-pack.
The git:// transport protocol was used for all our tests that involved client-server communication.
The Java code is running on OpenJDK:
# java -version
openjdk version "1.8.0_131"
OpenJDK Runtime Environment (build 1.8.0_131-b11)
OpenJDK 64-Bit Server VM (build 25.131-b11, mixed mode)
Scenarios
As I’ve already mentioned, this is not a micro-benchmark. We tried to observe performance as close as possible to the real use cases. Our assumptions include:
- A relatively small amount of concurrent users.
- A relatively small amount of files in a repository.
- The files are text — not binary.
- An individual file can be up to 50 KB.
- A user usually adds a new file, appends a line to an existing file, or updates a line so that conflicts can be resolved automatically by Git.
- A relatively large amount of repositories and branches.
- A user can tolerate long times when a repository is created or cloned.
In the first place we wanted to know how the amount of files in a repository, the size of a modified file, and a number of commits affect Git performance. We also looked at how other factors may come into play, for example whether increasing Java heap size improves overall performance of the setup.
In order to minimize the effect of caching, we cleaned up the directories and restarted Git daemon between runs.
Add File with JGit
- Create a bare repository, pre-populate it if needed, and clone it.
- Create a file in the cloned repository.
- Open the repository in JGit.
- Add the file for tracking via JGit.
- Commit the changes.
- Pull.
- Push.
- Close the repository in JGit.
- Repeat 2 through 9.
Modify File with JGit
- Create a bare repository, pre-populate it with a given number of files, each of a given size. Such a file is made up of unique lines — UUIDs.
- Clone the repository.
- Pick a random file and replace its last line (a random UUID) with a new one (another random UUID)
- Open the repository in JGit.
- Commit the changes.
- Pull.
- Push.
- Close the repository in JGit.
- Repeat 3 through 9.
Code
The code consists mainly of three Java classes. Two of them measure JGit performance in the two scenarios — add and modify. The third one creates and pre-populates Git repositories according to a number of input arguments.
Behavior of the main classes is customizable via command-line options. For example, a number of parallel threads and
the address of a remote repository can be specified. The Java commands are wrapped in bash scripts for convenience
— they construct the right CLASSPATH adding to it all the .jar files in a given directory.
The code is organized into a Maven build. The build copies all the required .jar artifacts into a separate
directory. You can just point your scripts to that directory for the CLASSPATH to be correctly constructed.
We tried JMeter for collection and aggregation of samples, but later decided against it as it created unnecessary development and runtime overhead.
There are also straightforward bash scripts to measure the same scenarios using the native git command. In
the scripts, we opted for the date command to calculate elapsed time in millisecond, as opposed to time. This is
due to the inconvenient output format of time.
In order to mimic the Java code that replaces the last line of a file, we wrote a simple and fast Go program.
We print samples as comma-separated values so that the results can be forwarded to a file and opened in spreadsheet software (e.g. Microsoft Excel).
Results
Add File
We first tried the “add file” scenario, starting with just a single empty repository and one branch. The repository is a remote one, served by git daemon.
There are a number of points to pay attention to:
First, as you can notice right away, the very first sample differs significantly from its successors. This is due to the JVM warming up. We will ignore the first sample from now on.
Open	Add	Commit	Pull	Push	Total
225	62	44	115	62	508
1	3	6	8	52	70
1	2	6	9	52	70
0	2	5	7	51	65
1	2	5	8	51	67
1	2	10	10	53	76
Next, let’s look at the chart below.
NOTE: All graphs in this document, unless explicitly stated otherwise, use milliseconds on axis Y and sample count on axis X.
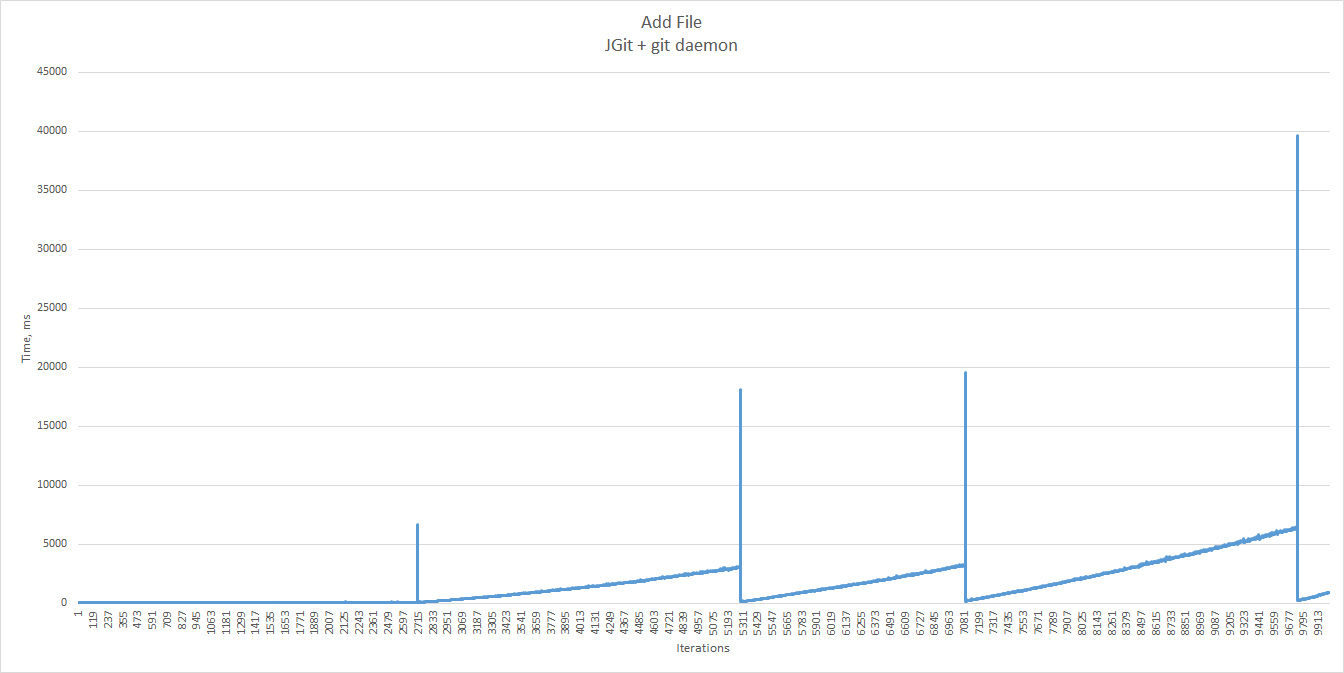
Apparently, at some point the setup becomes too slow for any acceptable user experience. But can we still use it in the lower range?
Let’s zoom in at the leftmost section of the chart.
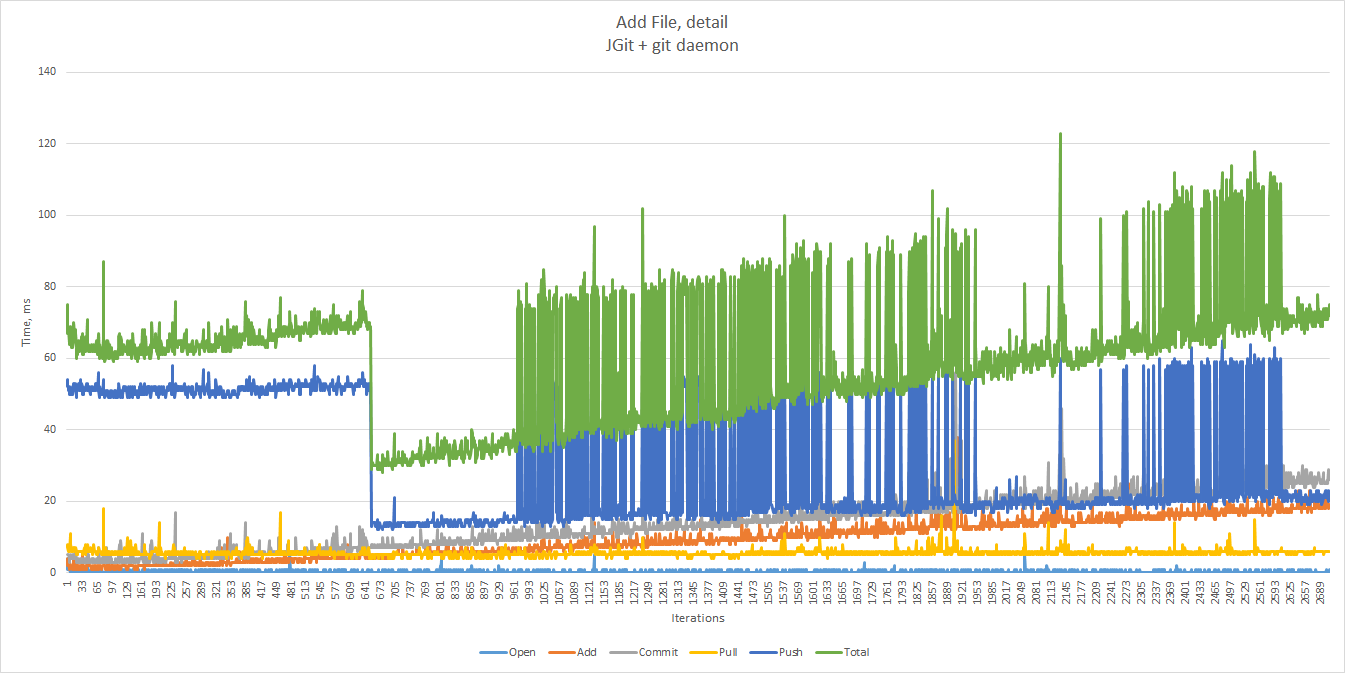
- In most cases the entire scenario takes less than 100 ms. The 90th percentile is 79 ms, the 99th percentile is 107 ms.
- Time spent opening a repository in JGit is negligible.
Push,addandcommittimes grow steadily with the amount of files, and add up to a total of ~110 ms at the end of the range.- The scenario spends the majority of time performing
push. - There is a sudden drop in
push, followed by a sudden rise.
100 ms seems reasonable, but we are concerned with those add and push times growing constantly. Git is notorious
for its inability to handle very large repositories, but what is the limit we can push it to with Zusammen?
We have seen this time and again in our benchmarks — the time it takes to perform add, push and commit
with JGit and git daemon increases as a function of repository size.
Modify File
To benchmark the file modification case, we start with an existing 50 KB file and change it many times.
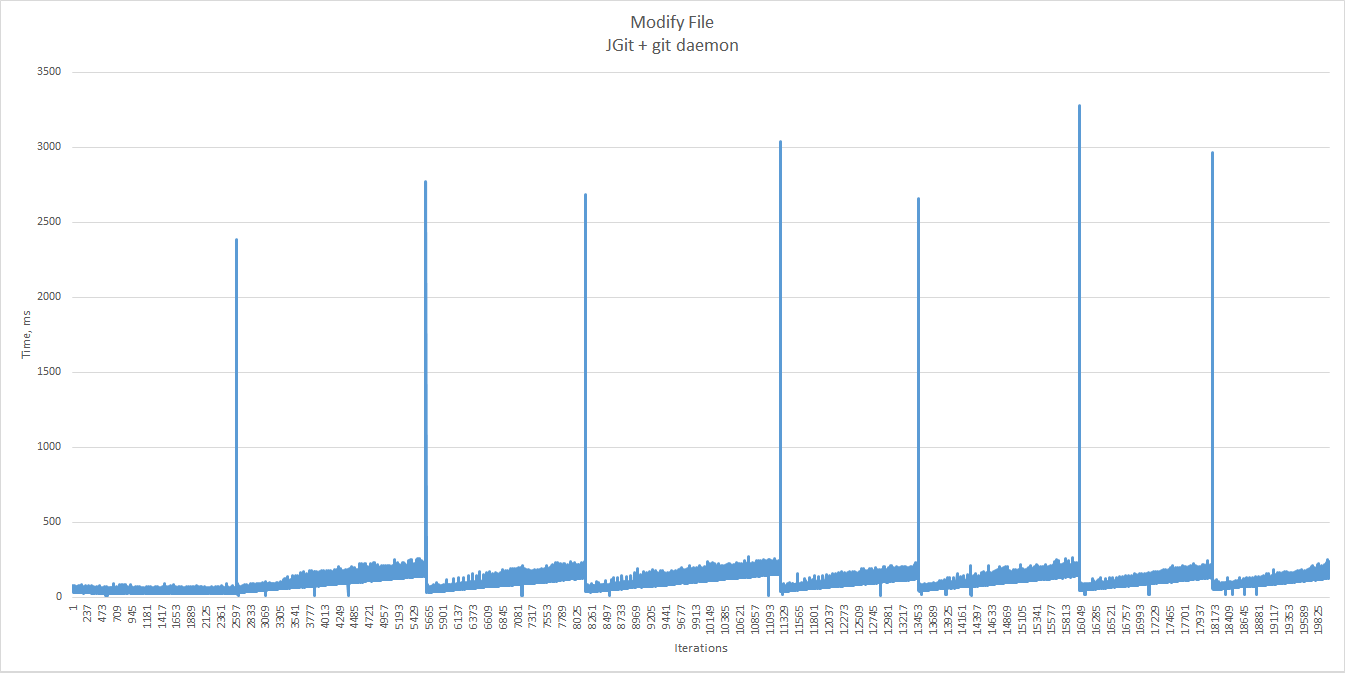
Let’s focus on the first section of the chart.
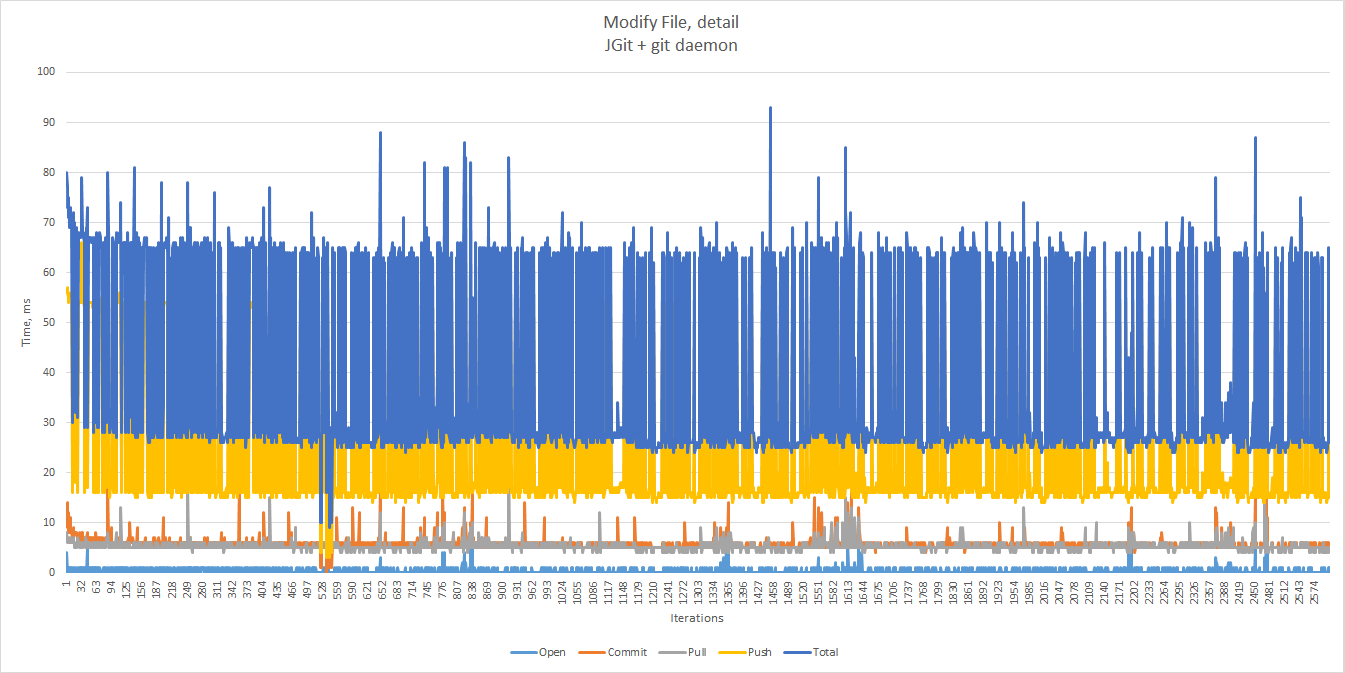
There are no significant changes as the number of commits increases, with the total time well under 80 ms in most cases — up to the first outlier. The 90th and 99th percentiles there equal 66 and 73.97 ms respectively.
Push is again the main cause of performance degradation.
The test occasionally failed with
org.eclipse.jgit.api.errors.JGitInternalException: No changes
        at org.eclipse.jgit.api.CommitCommand.createTemporaryIndex(CommitCommand.java:488)
        at org.eclipse.jgit.api.CommitCommand.call(CommitCommand.java:237)
        ...
The reason is probably some sort of caching or (who knows) a bug in JGit — the file does show up as modified when
running git status after the failure, and can be successfully committed afterwards. Setting
CommitCommand.setAllowEmpty(true) does not help. In any case, we did not investigate much into this failure, but
had to cheat by ignoring the exception in order to reach the desired number of commits. Unfortunately, this also
lead to slightly skewed results.
As usual, we drop the first sample to ignore JVM warm-up.
Multiple Threads/Processes
For simplicity, we ran the threads/processes in our multi-thread/multi-process tests each against a separate combination of repository, branch and file to avoid too complex conflict resolutions.
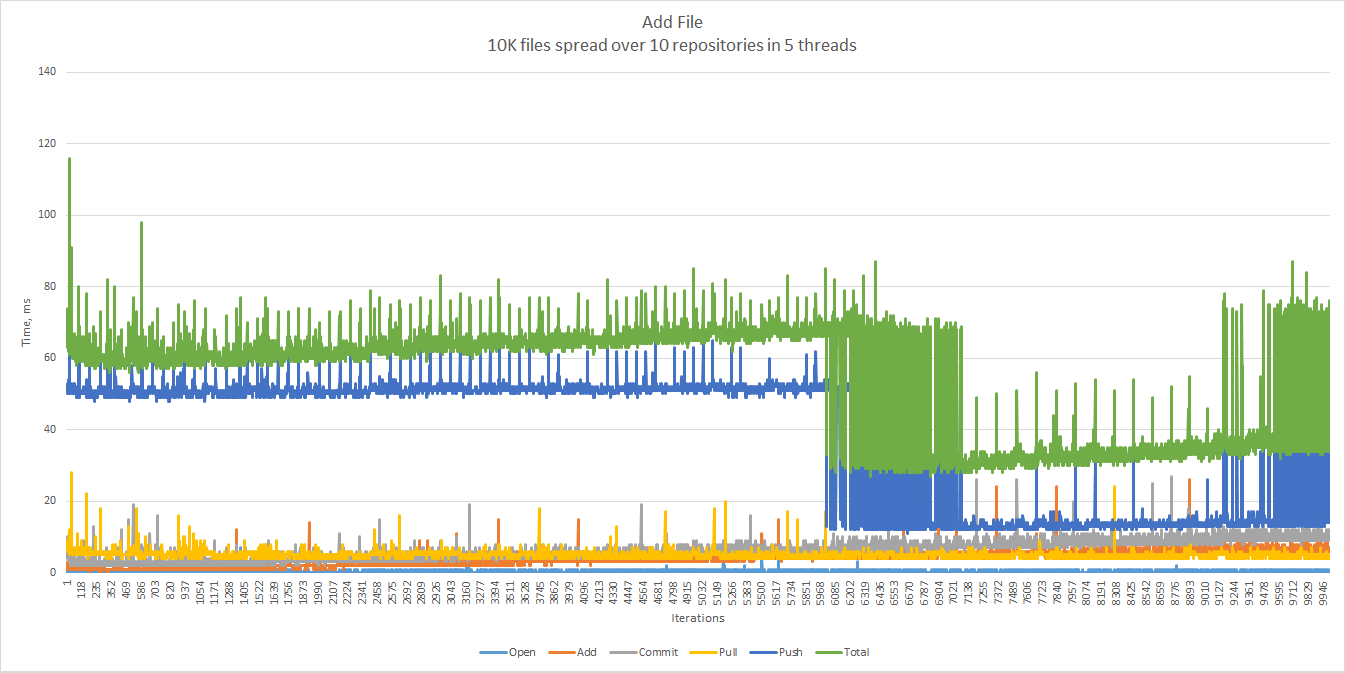
Here are the result of five parallel threads. Each thread adds 2,000 files, each file to a repository randomly chosen out of 10 repositories created beforehand. That’s 10,000 files total. The 90th percentile is 67 ms, the 99th — 74 ms.
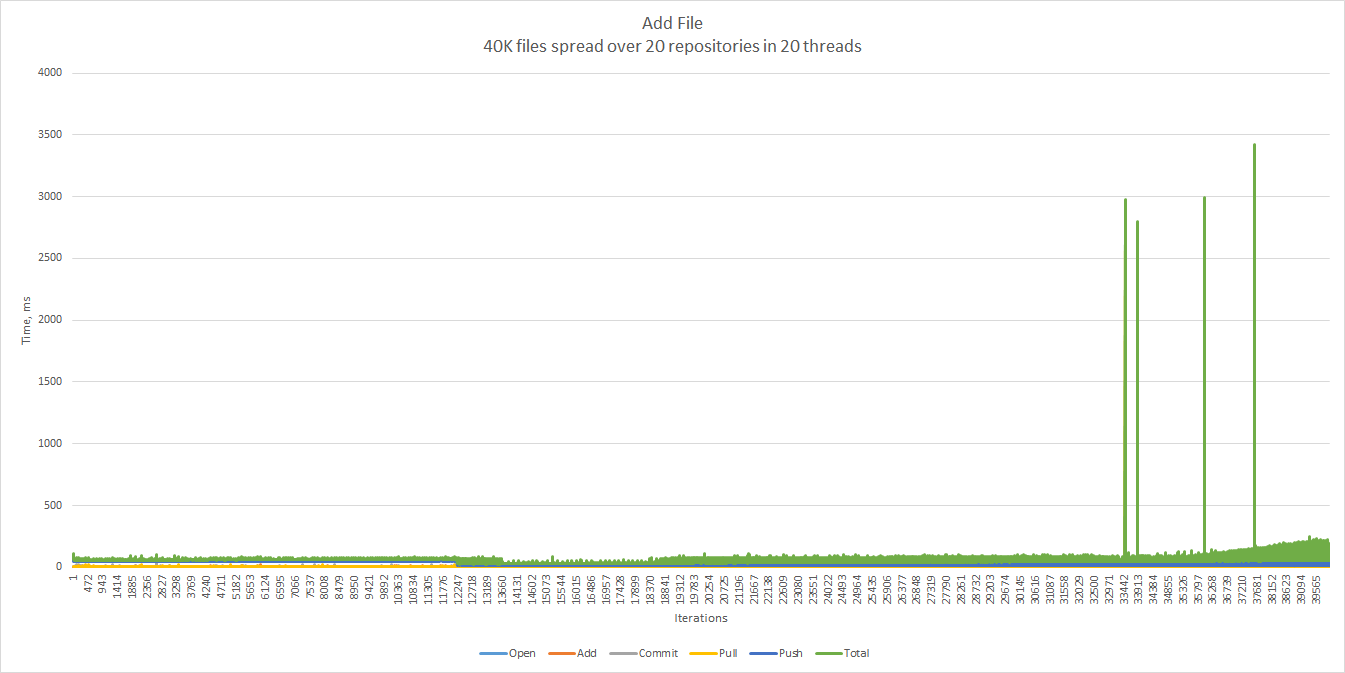
And now 20 threads, 2,000 files, 20 repositories, which sums up to 40,000 files.
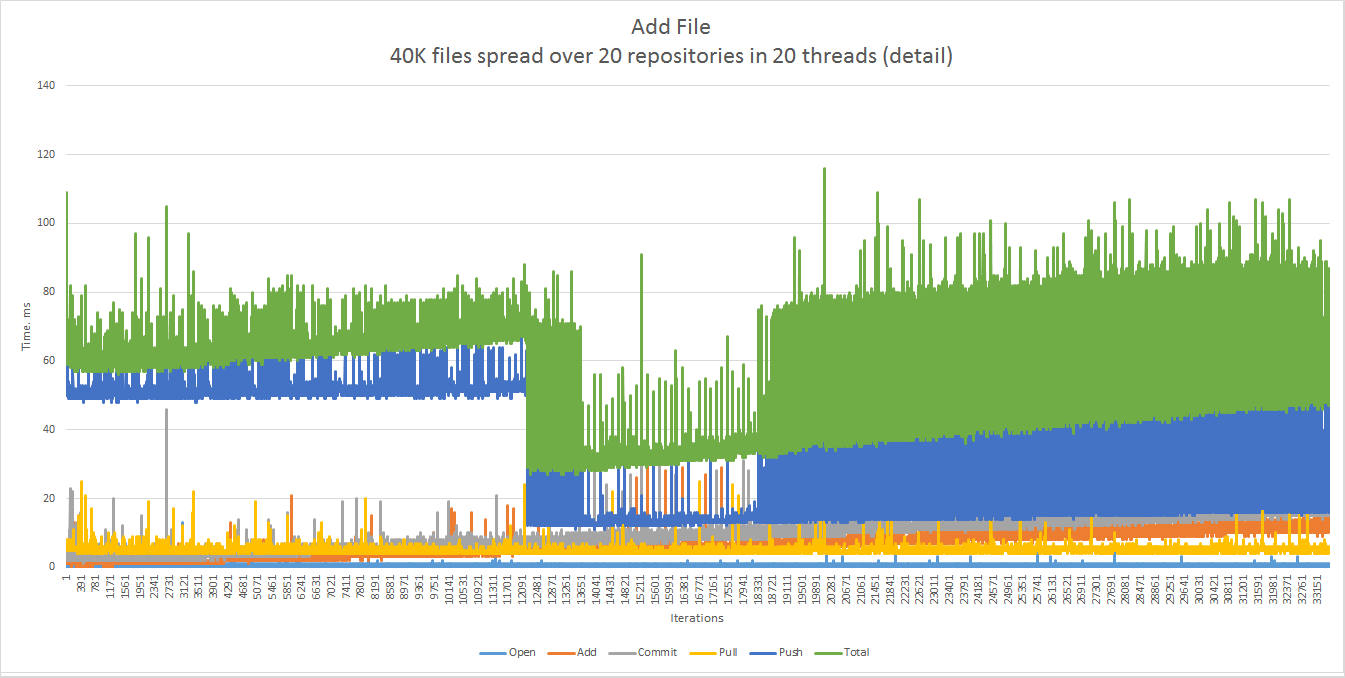
The same chart before the first spike. The 90th percentile is 72 ms, the 99th percentile is 87 ms.
Modification scenario: 20 repositories and 20 threads, each modifying at random any of the 100 files in its corresponding repository during 2,000 iterations. Each file is ~50 KB in size. The percentiles are 65 (90th) and 70 (99th) ms.
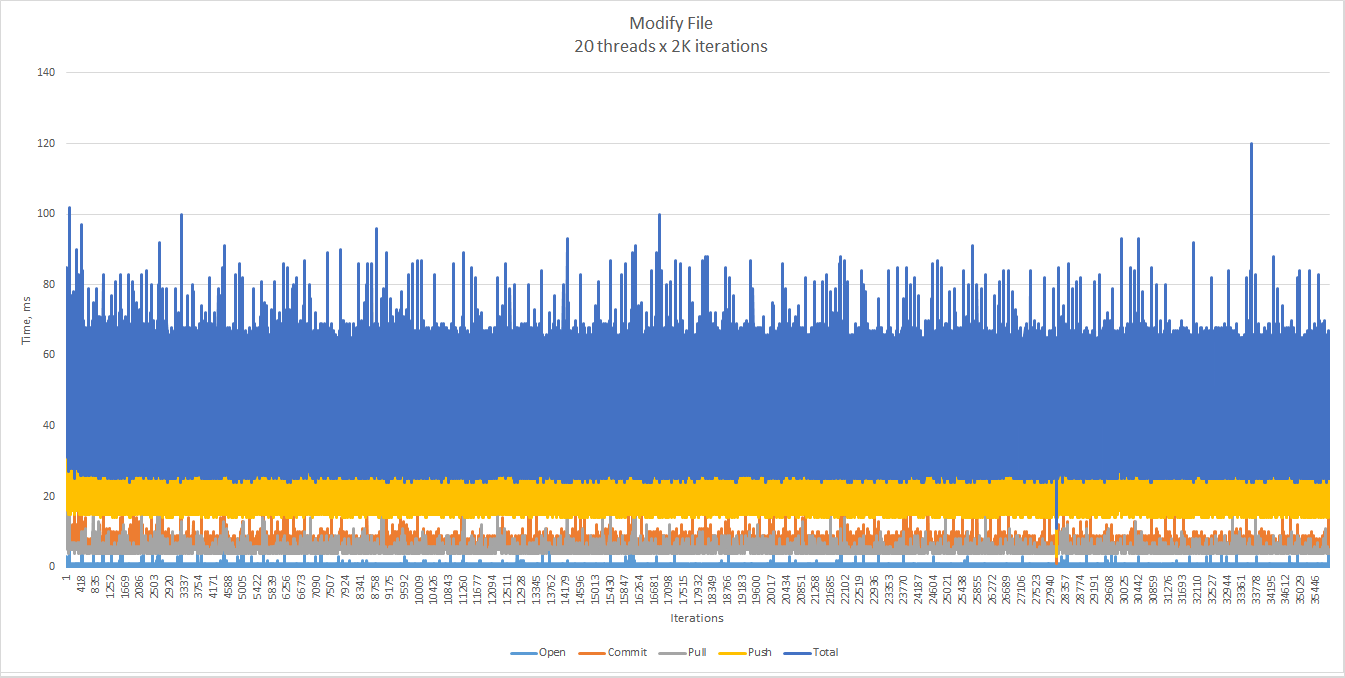
Clearly, neither the number of threads, nor the total number of commits affects the performance as much as the number of files in a particular repository does.
Large Pre-populated Repositories
We wanted to see if large quantities of dormant in the background repositories, branches, or files affect performance.
A typical scenario looks like follows:
- Create R bare repositories, each with B branches, each branch contains F files.
- Clone the repositories.
- Run multiple threads, when each thread adds a file to the HEAD branch of a random repository, or modifies a random existing file in the HEAD branch.
Here are the most important observations we made:
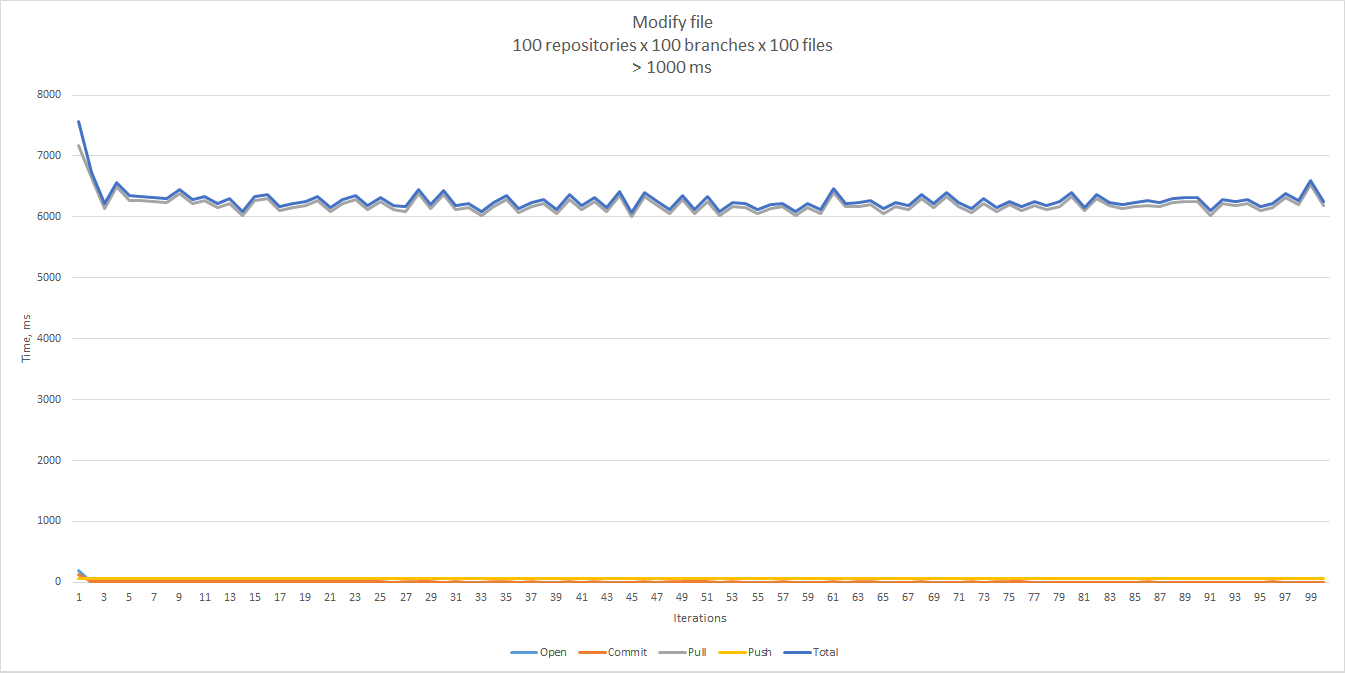
The response times were affected mostly by the number of branches, and much less by the number of files in a branch or the number of repositories. With ten branches we did not see any noticeable differences, while 100 branches caused very long response times at the beginning of a test.
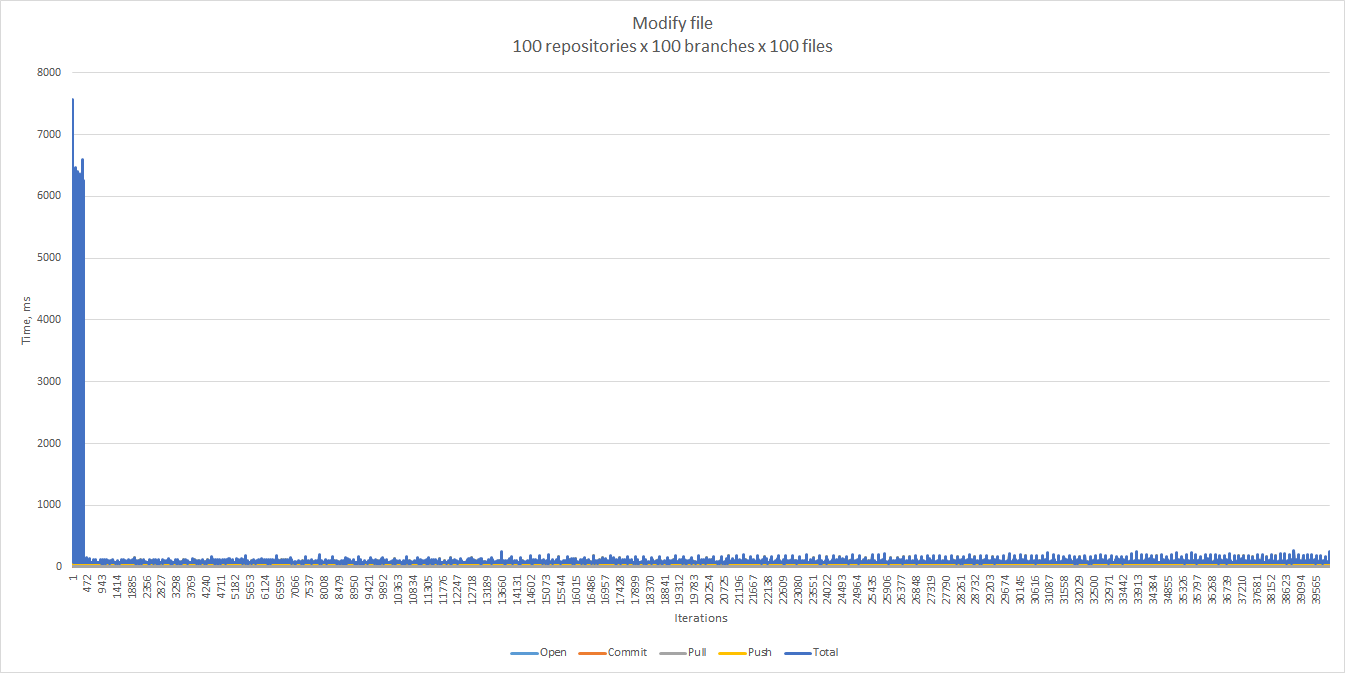
It turns out that there is an exactly one peak for each repository, and it corresponds to the very first pull from
that repository.
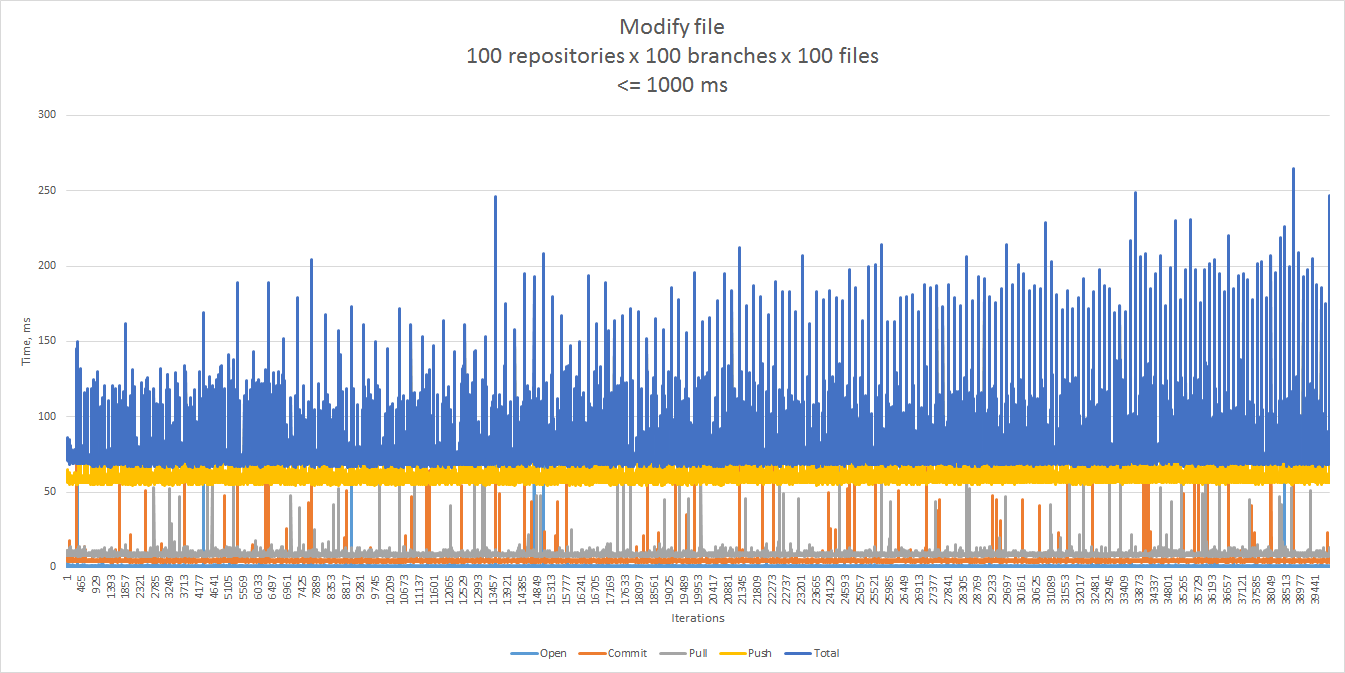
The rest of the samples look more reasonable, and give 75 ms for the 90th percentile, and 121 ms for the 99th.
The “add file” scenario showed a similar pattern.
A simple experiment where we gradually increased the number of branches while keeping the other parameters unchanged
helped us find out when the first pull starts taking a few seconds for some repositories — the tipping point
falls between 50 and 60 branches per repository.
We did not experience the first-pull phenomenon, and also saw better response times when we started with identical branches and then diverged, as opposed to having 100 totally different files in each branch. Luckily, this is also close to our real-life scenarios. The 90th percentile — 73 ms, the 99th — 112 ms.
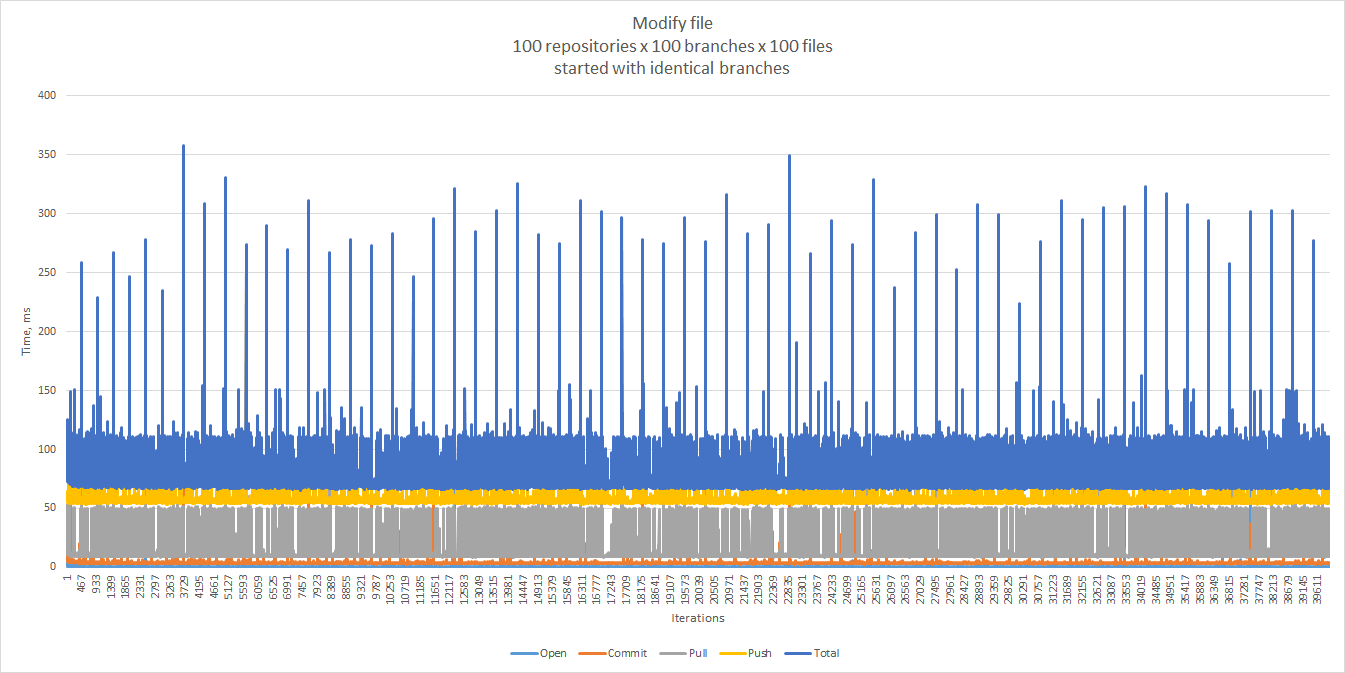
In any case, it may be a good idea to mitigate the first-pull problem, for example, by making it part of an asynchronous setup operation.
Cloning a single branch (corresponds to git clone --single-branch) further improved the response times.
In general, working with a single-branch clone noticeably improved the response times in all tested scenarios. Moreover, this approach has proved critical for working with different branches of the same repository in parallel.
Concurrent Commits with Auto Merge
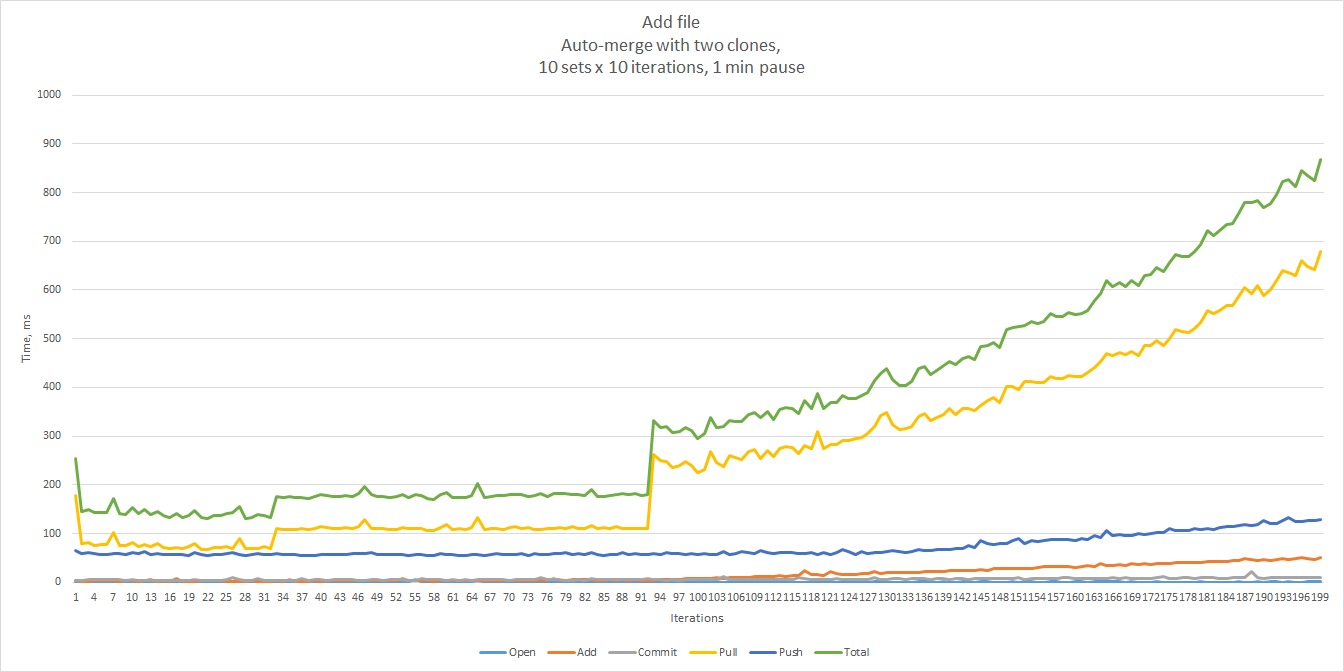
Although we do not expect conflicts to happen often, they are unavoidable. We used the following test to simulate concurrent commits that can be merged automatically.
- Create a repository and populate it.
- Clone the repository twice. Let’s call the clones “Clone A” and “Clone B”.
- Add a unique file to “Clone A”, commit, pull, push.
- Add a unique file to “Clone B”, commit, pull, push.
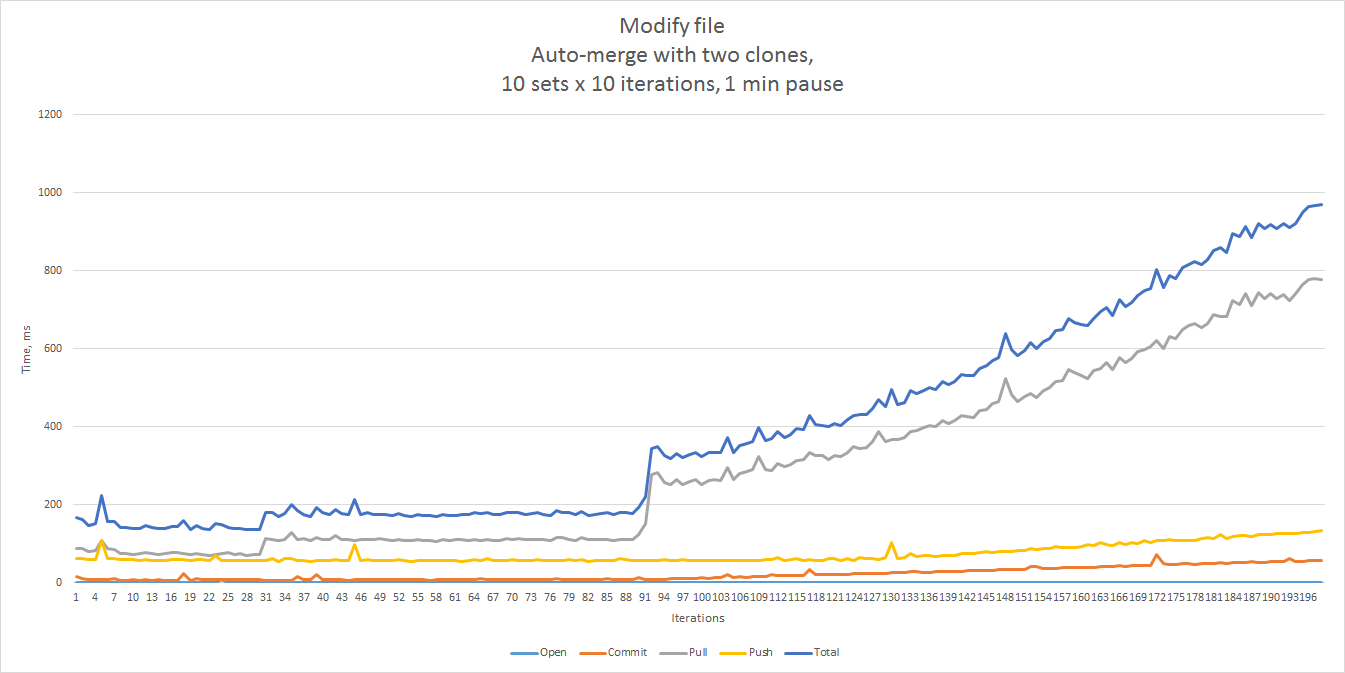
For the modification scenario, each time a different file was changed.
The results shown below were obtained by running 100 iterations in 10 sets (10 iterations each), with a one-minute
pause between the sets. In this case we ran the tests against two clones of a repository. As you can see, the
response times are not spectacular, but acceptable assuming that such conflicts are rare. Unsurprisingly, pull was
the major contributor to the total.
File-System vs. Git Protocol
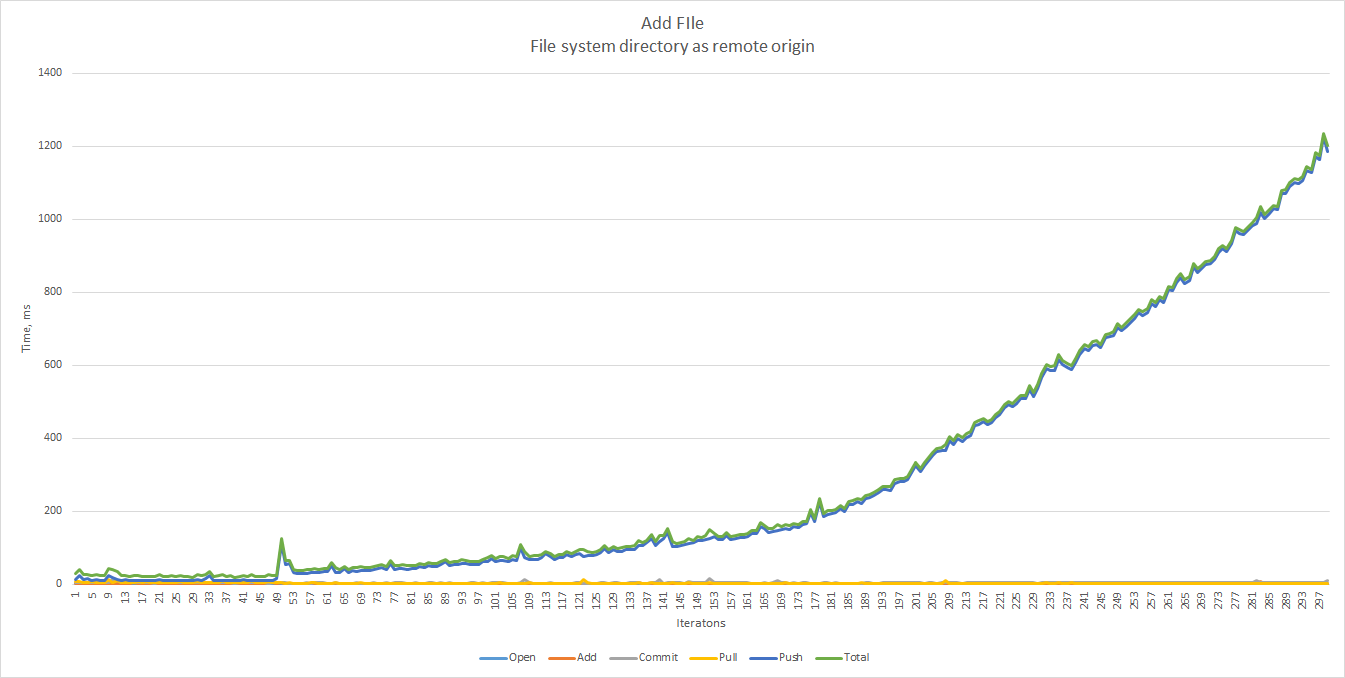
It is possible to use a local file-system directory as a remote origin. In this case we do not need a git daemon, as JGit will handle all Git operations. As we can see, the performance in this case is unacceptable already at 300 files.
JVM Memory
The analysis would have been incomplete if we had not tried to tune the JVM. We increased the heap size (-Xmx and
-Xms) and enabled GC logging (-verbose:gc) to see if garbage collection correlates with the performance charts in
any way.
For the full list of parameters available on OpenJDK execute java (without options), and java -X for extended
parameters.
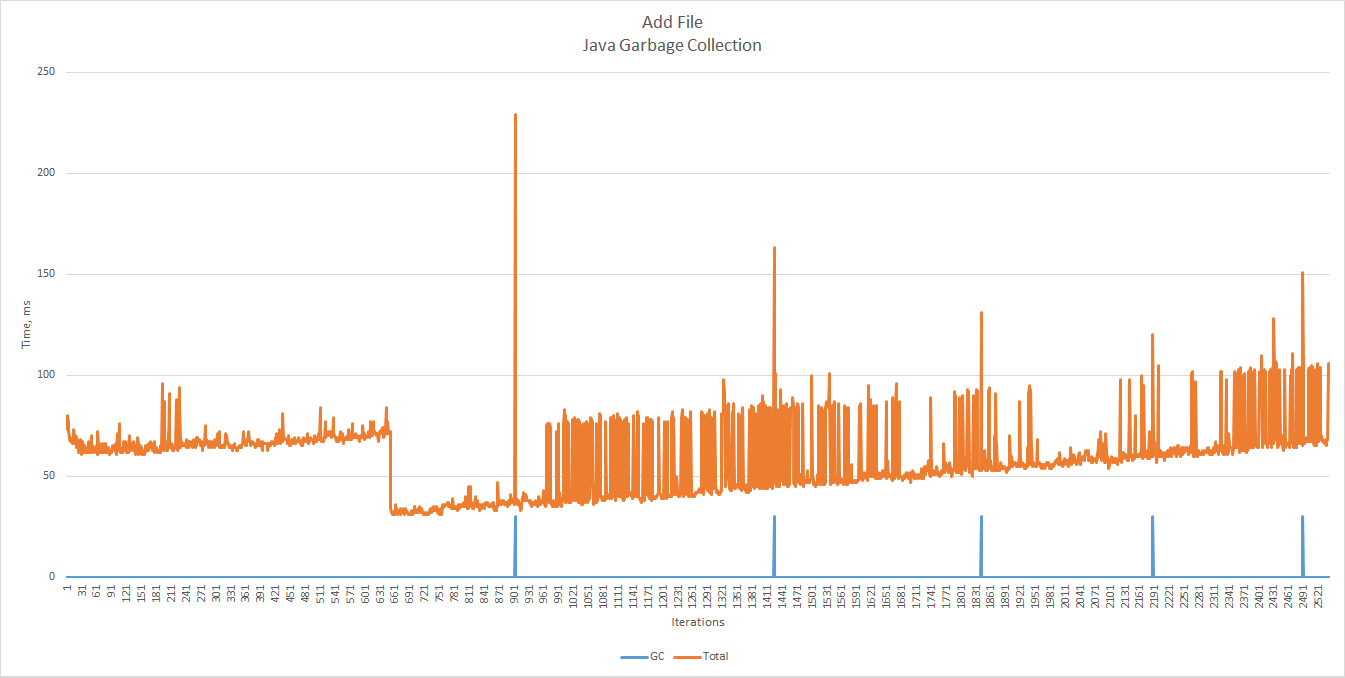
As expected, most of the peaks fall on GC pauses.
Let’s try to change the heap and see how the performance changes.
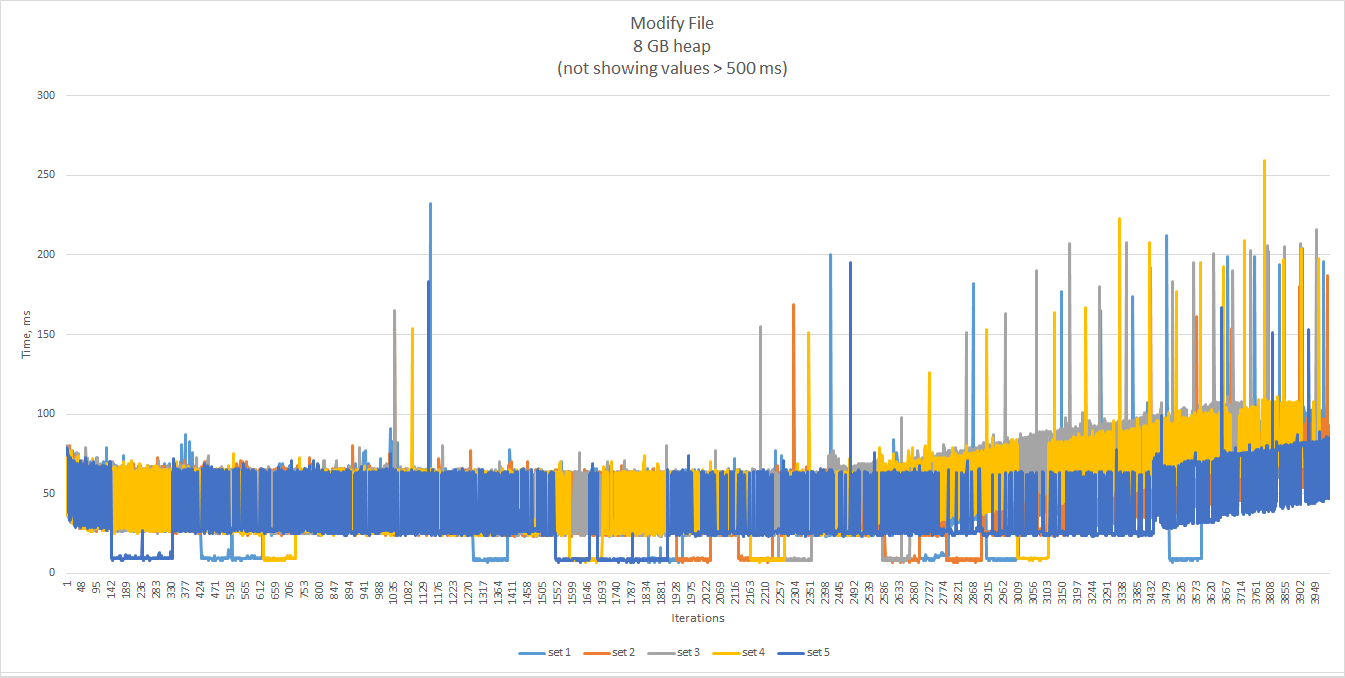
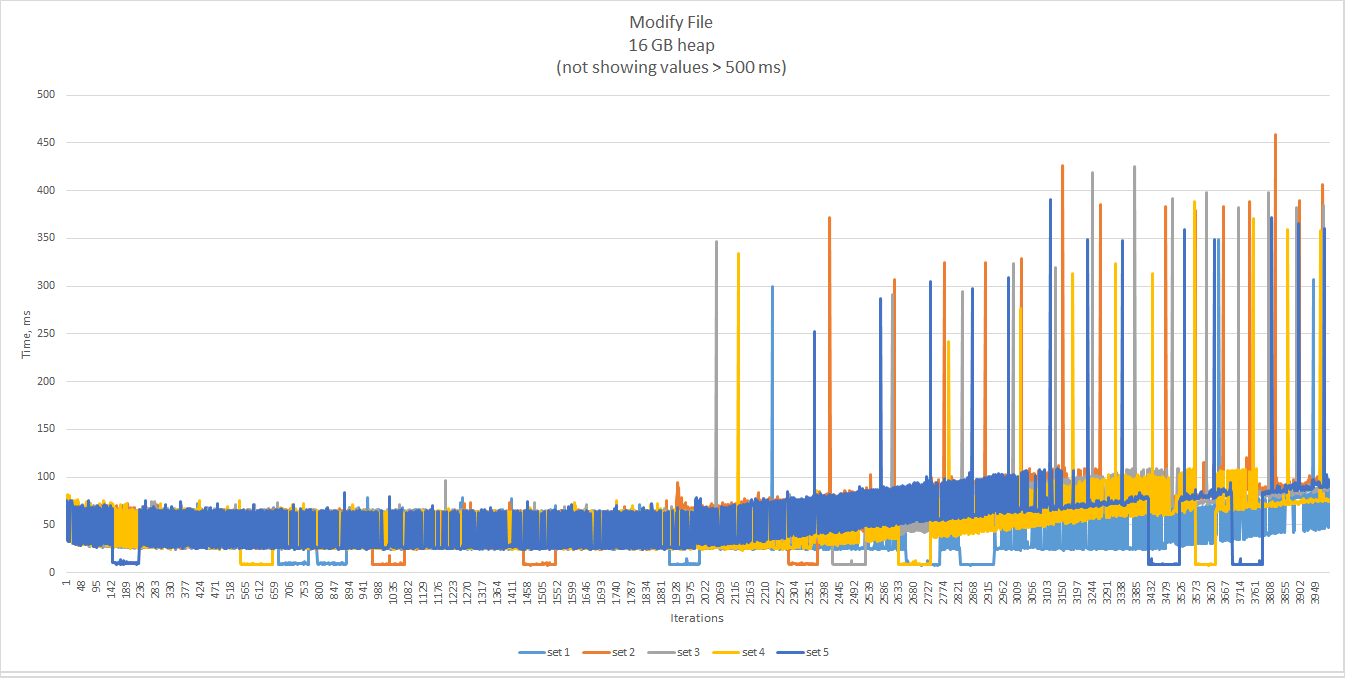
With more memory, GC pauses are longer, but less frequent, and enable the chart to stay almost flat longer.
In any case, long GC pauses are pushed to the upper range of the time line, when they become very frequent and the
total execution time climbs noticeably up.
Native Git Command
Let’s see how the JGit performance compares to that of the native git command.
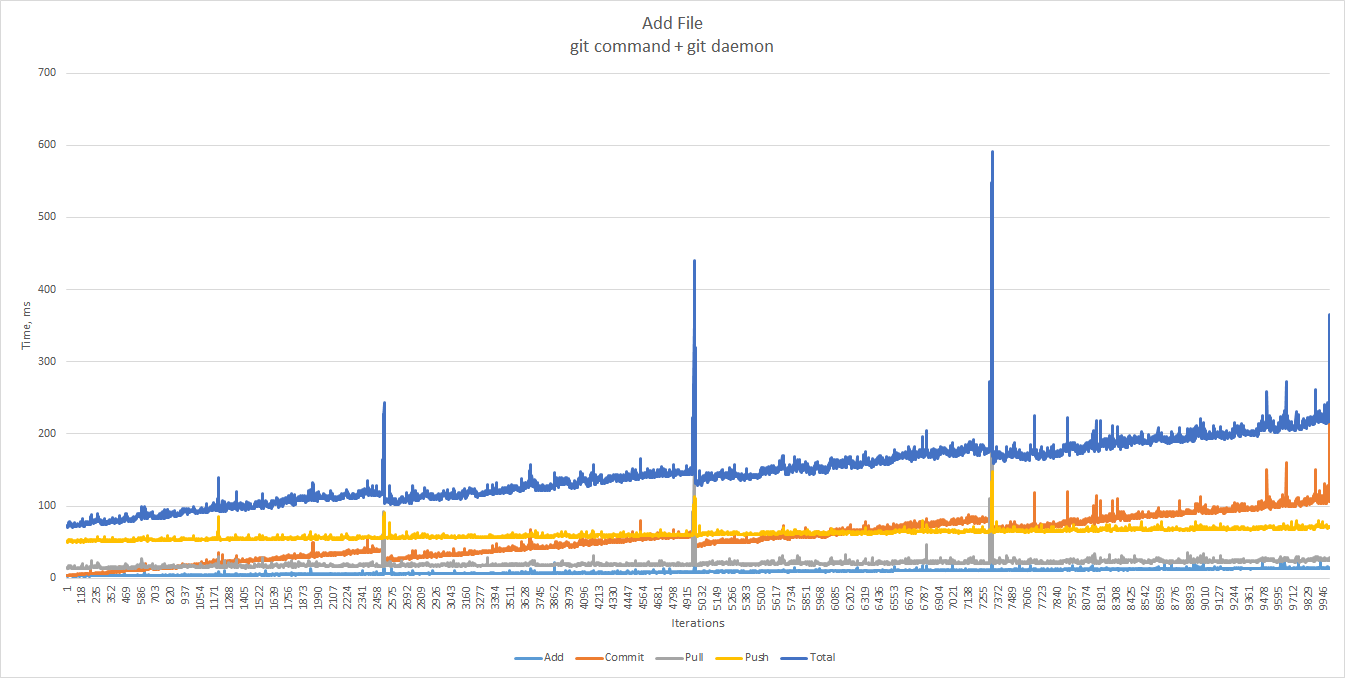
The same graph up to the 2700th sample. The 90th percentile gives us 115 ms, the 99th — 123 ms.
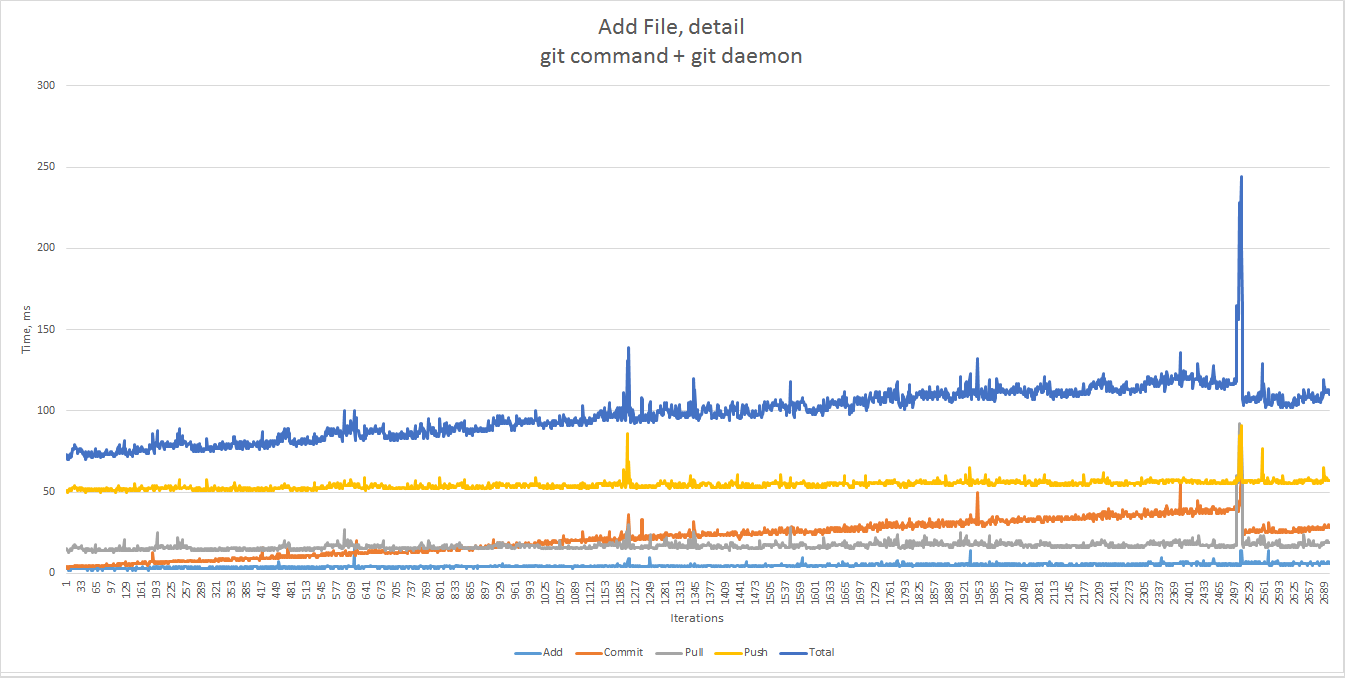
Interestingly, JGit seems faster in our working range than Git, which gives 80 ms for the 90th percentile and 84 ms for the 99th one. In the case of git command, some of it can probably be attributed to the overhead of spawning an OS process from a shell script. On the other hand, Git is more consistent over time.
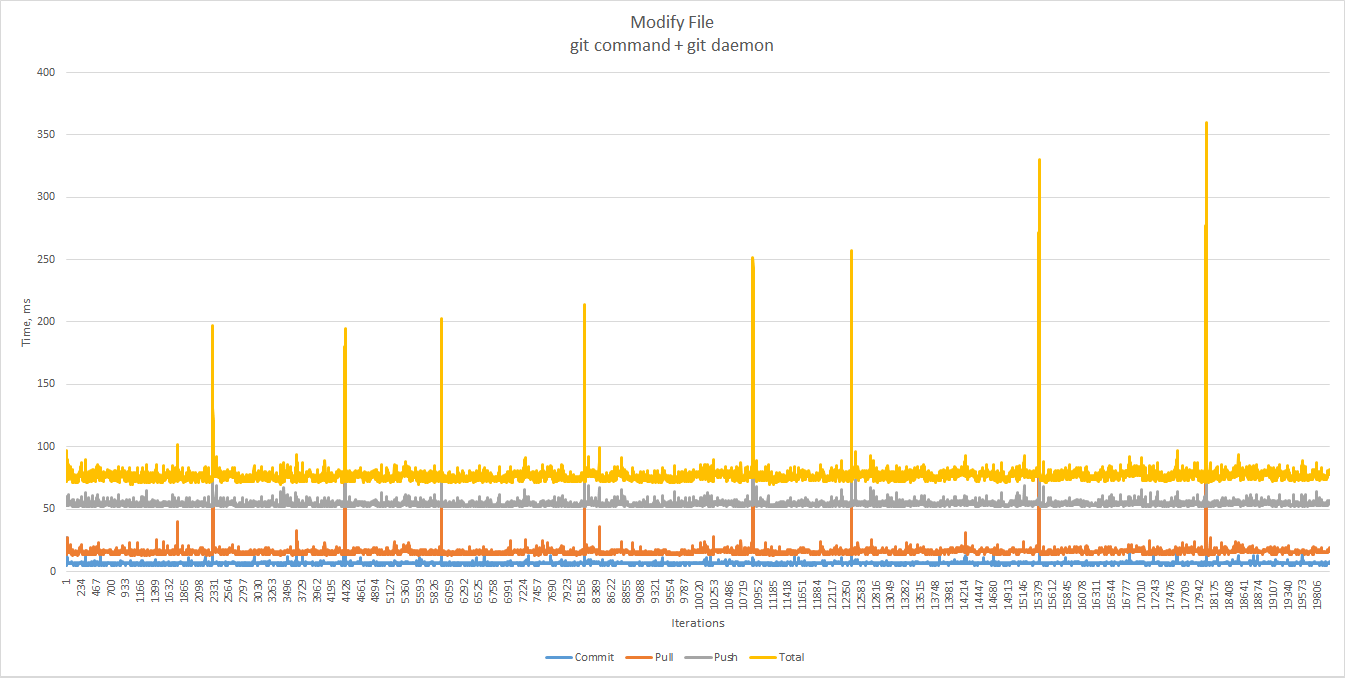
Again, the performance degrades as a repository size grows, and is not affected by the number of commits.
For our tests we executed a range of scenarios and variations using the git command, including running parallel processes similar to Java threads, but the overall behavior looks similar to that of JGit.
TODO
Unexplained Peaks
Apparently, the performance degradation as a function of repository size is due to the way data is organized in Git. When using JGit, most of the outliers can be explained by GC pauses. But what about the spikes — very significant ones — that do not correlate with GC, and occur also when using the native git command? What are the processes that cause the performance to drop so suddenly? And, most importantly, can we prevent it?
Auto Merge
So far, the only pain point has been relatively slow automatic merges related to concurrent modifications. Although we do not expect this to happen frequently, we should look for ways to reduce response times in such cases.
Housekeeping
Git offers a number of housekeeping commands, for example git-gc. We do not expect them to be a game changer in our use case, but their effect on performance is definitely worth exploring. The jigsaw pattern in the charts also indicates periodic housekeeping processes.
We also believe that the operating system can be fine-tuned for Git workloads, as well as the JVM.
Conclusions
JGit paired with git daemon is a viable option for Zusammen. It gives a good baseline in terms of performance, which we can start to work with. Our setup could comfortably handle up to around 2,000 file-change commits and hundreds of repositories with up to 2,000 files each, under high load and without any special tuning. Even though file modification times always remain within reasonable bounds, file addition times do not. Therefore, we should stay with relatively small repositories, and limit the number of branches. Steps should be taken to mitigate a few corner cases, and to work with single-branch clones whenever possible.